1969 Quarter Value and Investment Outlook
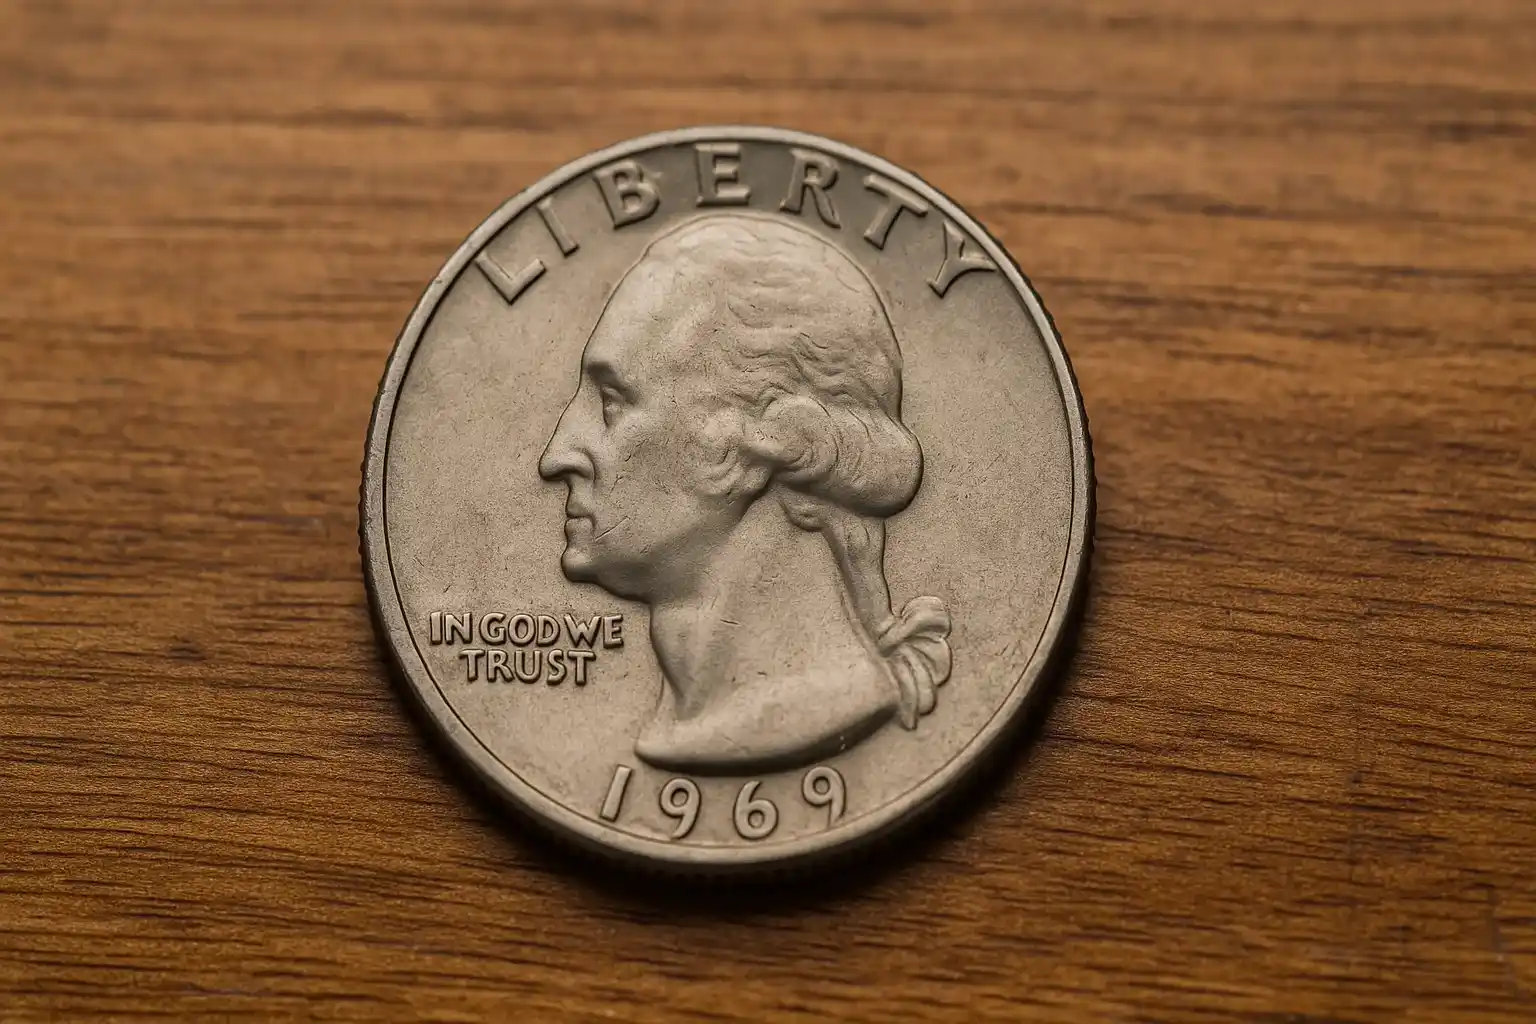
The 1969 Washington quarter, though a common circulation coin at first glance, occupies an important place in the broader numismatic and alternative asset market. Struck during the clad coinage era, it does not contain silver, yet its value trajectory and collectability in high grades provide investors with insight into how non-precious-metal coinage can still appreciate in a diversified portfolio.
So, let’s learn the 1969 quarter value today.
Composition and Market Fundamentals
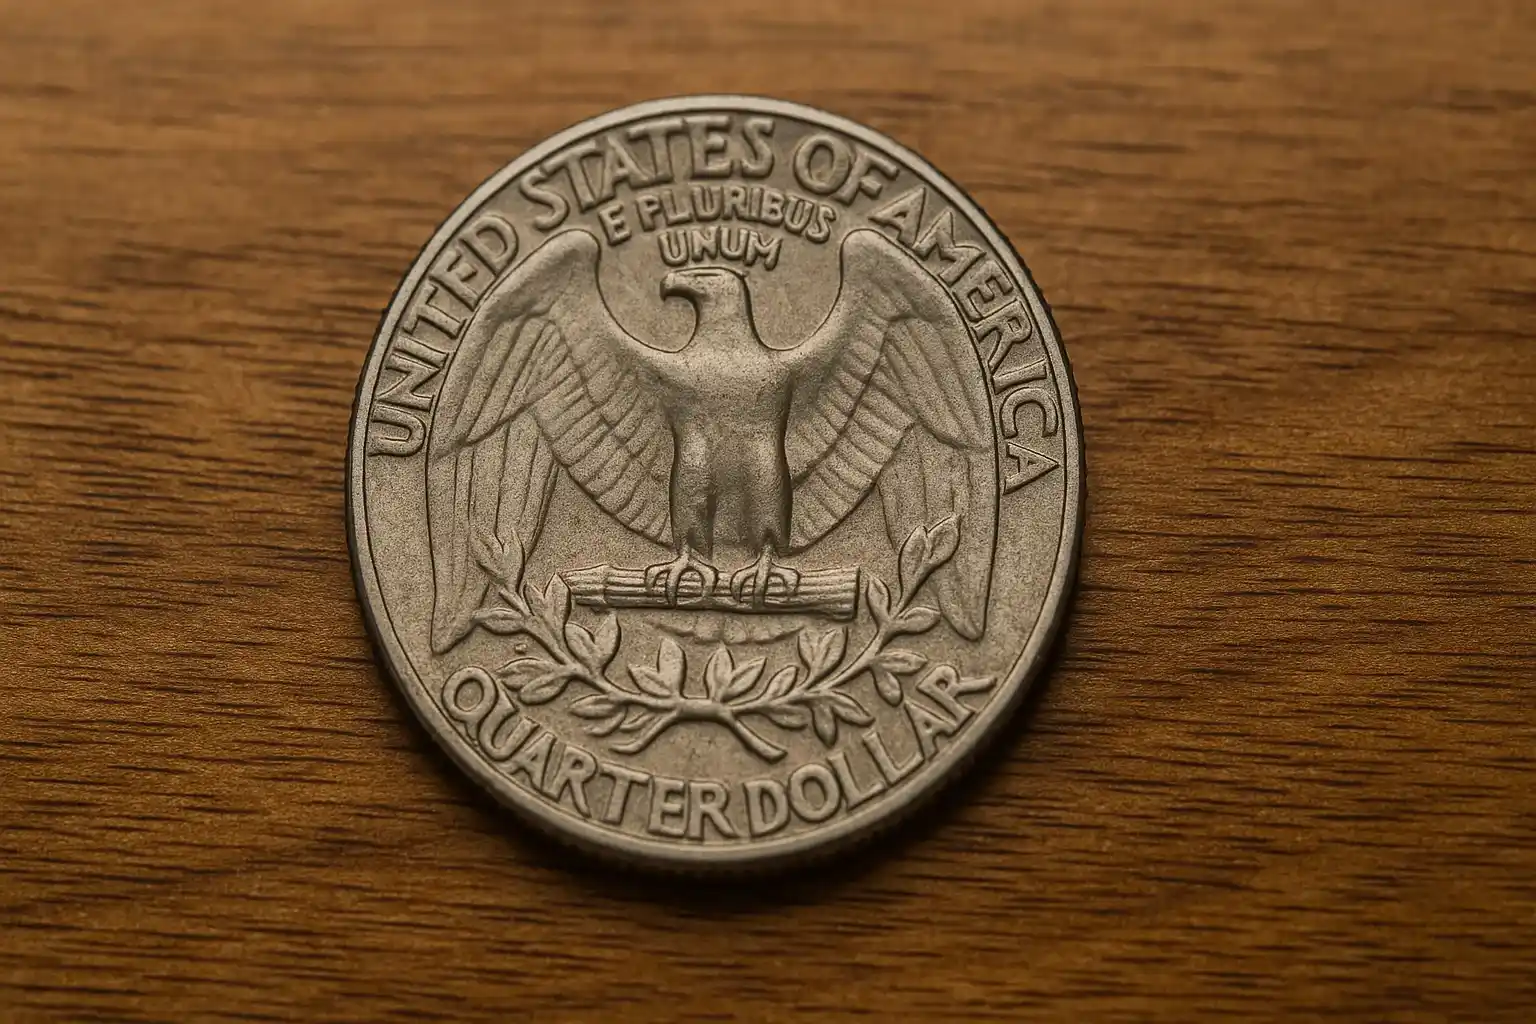
The 1969 quarter is composed of a copper–nickel clad over a pure copper core. With a mintage exceeding 1.1 billion pieces across Philadelphia, Denver, and San Francisco, its baseline supply was abundant. From an investment standpoint, the intrinsic melt value is negligible, but the real driver of premium lies in condition scarcity and proof issues.
The investment group perspective requires distinguishing between:
Circulating assets: Standard circulated examples that hold only face value.
Numismatic premiums: High-grade Mint State coins and deep cameo proofs certified by leading grading agencies (PCGS, NGC).
Error premiums: Off-metal strikes, double dies, and proof varieties that create asymmetrical value opportunities.
Value Breakdown
In today’s market, the 1969 quarter in circulated condition trades at nominal value. However, certified Mint State examples begin to show exponential growth:
MS65: $10–$20 range
MS66: $40–$75 range
MS67 and above: $300–$1,500+, with significant demand among registry set collectors
Proof quarters struck at San Francisco (1969-S) command premiums depending on strike quality, cameo contrast, and grade. PR69DCAM specimens regularly achieve auction results above $200, and in rare PR70DCAM condition, the coin enters the four-figure range.
From a valuation standpoint, the supply-demand imbalance in these upper echelons is a classic case of condition rarity economics, where fewer than 1% of all surviving coins meet the premium-grade threshold.
1969 Quarter Value Table by Mint and Grade
Mint / Grade | Circulated (G–XF) | AU (About Unc.) | MS60–MS64 | MS65 | MS66 | MS67 | Proof (PR67–PR70) |
1969 (Philadelphia) | $0.25 | $0.30–$0.50 | $1–$5 | $10–$20 | $40–$75 | $400–$1,500+ | – |
1969-D (Denver) | $0.25 | $0.30–$0.50 | $1–$4 | $8–$18 | $35–$65 | $350–$1,200+ | – |
1969-S (Proof, San Francisco) | – | – | – | – | – | – | $15–$50 (PR67–PR68) $75–$200 (PR69DCAM) $1,000+ (PR70DCAM) |
Philadelphia and Denver coins in circulated grades trade only at face value, but premiums emerge in MS65 and above.
MS67 certified coins are the true investment drivers due to population rarity.
1969-S Proofs offer strong upside in PR69DCAM and especially in the elusive PR70DCAM category, where demand far exceeds supply.
Auction liquidity is highest in certified coins, particularly those from PCGS and NGC registries.
Investment Thesis
While the 1969 quarter lacks intrinsic silver content, it has become a compelling case study in numismatic asset appreciation. Investors and collectors pursuing long-term growth should note several points:
Liquidity: Circulated examples are liquid but hold no premium. Certified high-grade quarters, however, enjoy strong liquidity within the collector-investor community.
Volatility: Prices for MS67–MS68 certified pieces exhibit volatility tied to auction demand and registry competition.
Diversification: Incorporating modern clad-era rarities such as the 1969 quarter into a portfolio adds diversification beyond precious metal bullion plays.
Asymmetric Upside: Error coins and high-grade proofs can deliver disproportionate returns relative to initial acquisition cost, particularly in PR70DCAM condition.
Auction Performance Analysis
Recent auction data provides a quantitative look at the 1969 quarter’s performance. PCGS and NGC-certified MS67 examples have consistently commanded four-figure results, with peaks occurring when two or more registry participants compete. Proof issues in PR70DCAM are particularly scarce, often drawing aggressive bidding that pushes hammer prices beyond projected guides. This auction-driven price discovery is a cornerstone of value recognition in the numismatic asset class.
Risk Factors in Quarter Investment
Every tangible asset has associated risks, and the 1969 quarter is no exception. Key risks include over-supply of mid-grade coins, which can dilute returns, and market saturation in proof sets, as many were preserved by the public. Additionally, counterfeit risks, while lower for clad coins, still exist, making third-party grading essential for capital protection.
Comparative Numismatic Benchmarks
From an investment viewpoint, the 1969 quarter can be benchmarked against similar clad-era coins, such as the 1965 quarter (first clad issue) and the 1971 Eisenhower dollar (first clad large dollar). All share characteristics of low intrinsic metal value but high premiums in pristine certified condition. Comparing population reports across these issues illustrates the condition scarcity premium that underpins investor demand.
Portfolio Integration Strategy
Allocating funds into numismatic assets like the 1969 quarter requires a structured approach. Investors often dedicate a small portion of their alternative asset allocation (1–3%) to modern numismatics. The strategic entry point is at high grades (MS67/PR69DCAM and above), where price elasticity is most favorable. Pairing these coins with bullion holdings or pre-1965 silver coinage creates a balanced approach that blends intrinsic metal security with condition-based appreciation potential.
Long-Term Appreciation Outlook
Looking ahead, the 1969 quarter’s value proposition hinges on two factors: grading population stability and demand from registry collectors. As grading standards tighten and the supply of high-grade submissions plateaus, prices for top-condition examples should remain firm or appreciate. Over a 10–15 year horizon, the asset’s trajectory is expected to align with broader numismatic trends, producing low double-digit annualized returns for the finest known coins, while circulated examples will remain static at face value.
1969 Quarter Investment Scenario Projection
Scenario | Circulated Examples | Mid-Grade Certified (MS64–MS65) | High-Grade Certified (MS67+) | Proof (PR69–PR70DCAM) |
Worst Case | Remains at face value ($0.25) | Modest premium ($5–$20) | Market correction lowers demand, values soften to $200–$500 | Limited growth, $100–$400 ceiling |
Best Case | Minimal change, still face value | Gradual appreciation, doubling in 10–15 years | Registry demand pushes premiums to $2,000+ per coin | Rare PR70DCAM specimens exceed $2,500 at auction |
Conclusion
The 1969 Washington quarter may not appear at first to be an investment vehicle, yet in numismatics, value derives not only from metal content but also from grade distribution, certification scarcity, and market psychology. For institutional and private investors seeking exposure to alternative tangible assets, the 1969 quarter represents a niche but credible opportunity, especially in top-tier certified grades and error categories.
As with all collectibles, investors are advised to approach acquisitions with due diligence, leverage third-party grading for authentication, and consider long-term holding strategies to maximize appreciation potential.